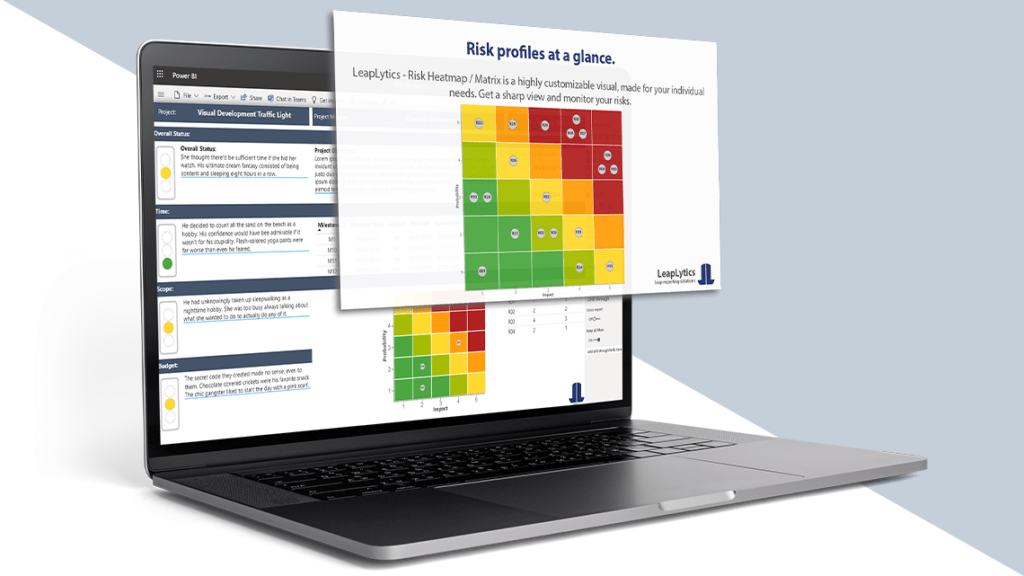
Risk Heatmap Visual
From 82,78 € per month
(1-3 year licenses)
Visualize your risks in a clear way with our Risk Heatmap / Matrix for Power BI and Qlik Sense. This visual allows you to analyze risks using a customizable matrix of up to 10 x 10. You can adjust the visuals to your needs with various settings.
Description:
- Annual or multi-year license
- You can use a license for one company (single legal entity) or a group/holding (multiple legal entities).
- 30-Day Risk-Free Guarantee + Lifetime Price Lock
- Expect to receive your license code via email within 24 hours of your purchase.
- If you want to use the visual in a commercial environment for your external customers, please contact us via mail .